Hello! I'm Nhật Hải.
With over 11 years of experience in MMO, business operations, and project management across multiple countries.
The Ultimate Ad Cost & Governance Mastery course is my third course since 2018.
After launching the LadiPage + Facebook Ads + Chatbot course in 2020, I spent the past five years focusing on building my company — gaining a wealth of experience in management along the way. Now is the right time to release a new course, tailored for those who need to manage advertising costs across multiple projects, countries, platforms, and teams.
My 11+ Year Journey Full of Challenges!
With over 11 years of experience in MMO and business, Hải is passionate about self-learning and independently managing every aspect of business operations from A to Z. Deeply interested in technology, data, and automation, Hải aims to minimize manual work and build automated systems that make it easy to scale projects efficiently.
Ultimate Ad Cost & Governance Mastery – Multi-Project, Multi-Country, Multi-Platform & Multi-Team Automation & Data Analytics
This comprehensive course guides you in effectively controlling advertising costs and building an automated governance system across multiple platforms, projects, and countries.
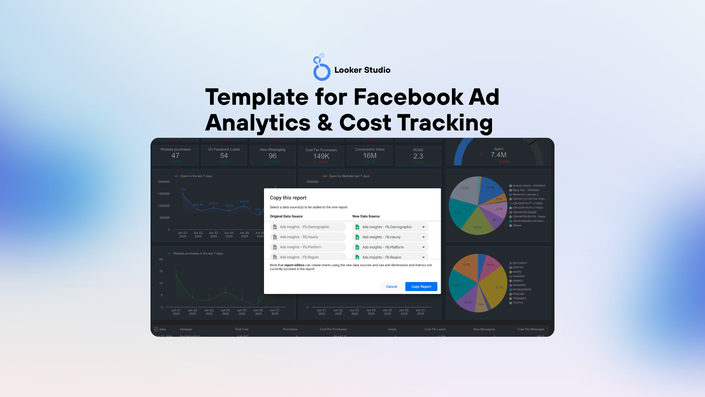
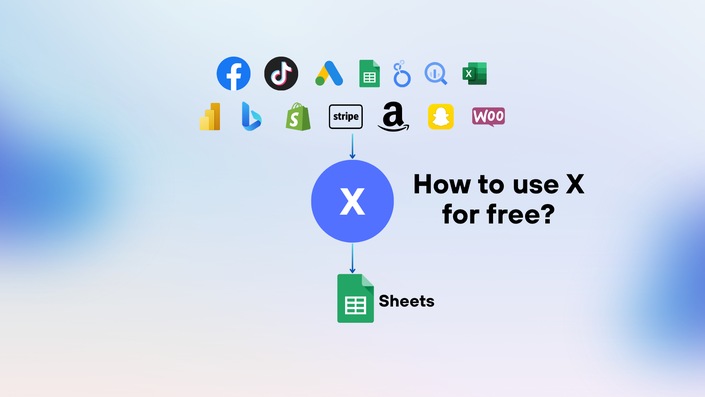
You’ll learn how to automatically collect ad data from Facebook, Google, TikTok, and more into Google Sheets, process and analyze it with Looker Studio, enabling faster and more accurate decision-making.
Beyond data analysis, the course also teaches you how to build scalable dashboards for various platforms, projects, countries, and teams — while implementing team access controls and a tight budget management workflow.
Whether you're an advertiser, manager, business owner, or data analyst, this course will help you improve performance, reduce waste, and scale campaigns in a structured and sustainable way.
You'll learn how to:
- Reduce costs and increase ROAS
- Make data-driven decisions with accuracy
- Automate workflows instead of relying on manual processes
- Easily manage multiple teams, projects, and markets
Recommended for:
Those with basic advertising experience looking to level up their skills in governance and data-driven management.


You will build an ad cost management dashboard using free tools.


What Will You Learn?
- Set up automated data flows from Facebook, TikTok, Google Ads, and other platforms
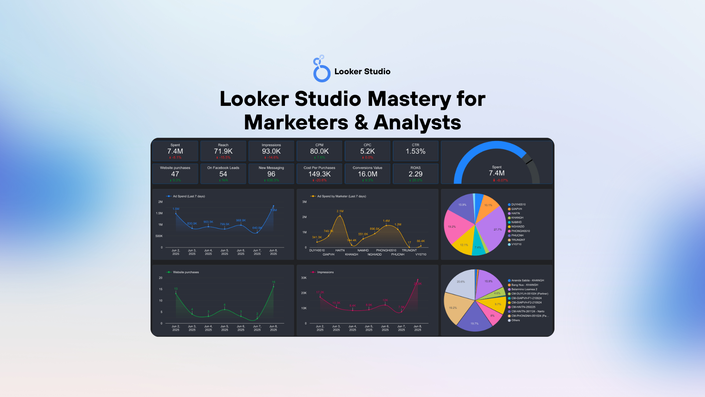
- Visualize data effectively using Looker Studio
- Manage a multi-project, multi-country, multi-platform, and multi-team system efficiently
Course Content Includes
- 1. Why Use Looker Studio for Ad Analysis? (5:50)
- 2. Connecting Google Sheets to Looker Studio (4:42)
- 3. Navigating the Looker Studio Interface (7:27)
- 4. Creating Dimensions and Metrics in Looker Studio (4:24)
- 5. Setting Up Theme & Layout (10:26)
- 6. Customize Chart Style (9:29)
- 7. How to Add and Configure: Table, Scorecard, Time Series, Bar (13:26)
- 8. How to Add and Configure: Pie, Geo Chart, Line, Area (7:02)
- 9. How to Add and Configure: Scatter, Pivot Table, Bullet, Treemap, Sankey (7:40)
- 10. How to Add and Configure: Gauge, Waterfall, Timeline, Funnel (5:15)
- 11. Adding Interactive Controls: Date Range & Filters (19:22)
- 12. Creating Basic Metrics & Custom Calculations (6:20)
- 13. Filter in chart (3:49)
- 14. Page Management & Responsive Design Tips (4:39)
- 15. Sharing & Publishing Your Report (5:15)
- Quiz
- 1. Advanced Calculations: GROUP, BIN (10:41)
- 2. Advanced Calculations: CASE WHEN, REGEXP,... (16:16)
- 3. Conditional Formatting (4:51)
- 4. Add a Field & Create Parameters for Dynamic Input (9:23)
- 5. Blend Data from Multiple Sources (14:18)
- 6. Automating Refresh Data in Looker Studio (2:02)
- 7. Common Issues & How to Troubleshoot Them (9:28)
- Quiz
- 1. Objective of This Practice (2:03)
- 2. Visualizing Ad Spend with Time Series, Bar Chart, and Line Chart (8:46)
- 3. Ad Spend Scorecard by Platform: Facebook, Google, TikTok (6:14)
- 4. Advertising Budget Insights by Country, Objective, and Account Status (7:32)
- 5. Ad Spend Details by Marketer, Product, and Platform (12:32)
- 1. Objective of This Practice (3:44)
- 2. Prepare Your Facebook Ads Data (5:27)
- 3. Ad Performance Scorecard Overview (9:13)
- 4. Cost, Conversion, and ROAS Scorecard Overview (5:43)
- 5. Ad Spend Trends and Distribution: Line Charts & Pie Charts (5:26)
- 6. Ad Performance Metrics Table (5:42)
- 7. Ad Performance Breakdown by Gender and Age: Table & Pie Charts (2:26)
- 8. Ad Spend Analysis by Hour and Placement (4:44)
- 9. Ad Performance by Region: Table & Heatmap Visualization (5:59)
Share how to use free tools worth $4,378
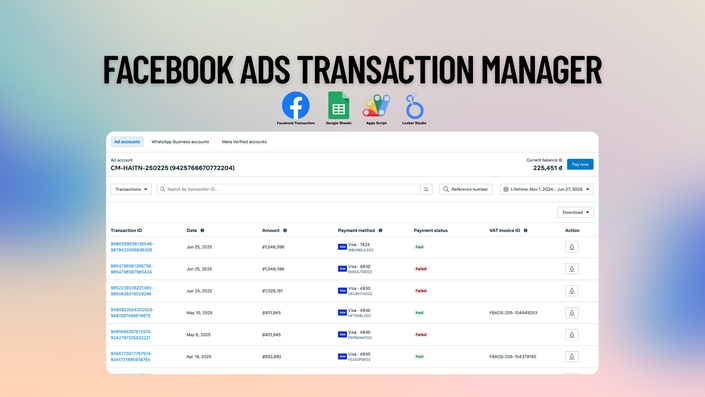
A tool that automatically pulls advertising costs from multiple platforms and over 50+ other data sources.

Professional Learning Interface

Learn Conveniently with the Teachable App


You Get 2 Bonus Contents Included!
The $169 course comes with the following 2 bonus modules — absolutely free.
![[EN] Trần Nhật Hải](https://static-media.hotmart.com/p1gtp39KAc-RITPiaF7SBq57fsk=/30x30/https://uploads.teachablecdn.com/attachments/caf0d45e8caa44cea6501e8039d24599.png)