Who Is This Course For?
- Marketers, analysts, or anyone who needs to present data in a clear and visual way
- Those who want to create beautiful, shareable dashboards — without coding
- Anyone spending too much time on manual reporting and looking for a professional, automated solution
What You Will Learn
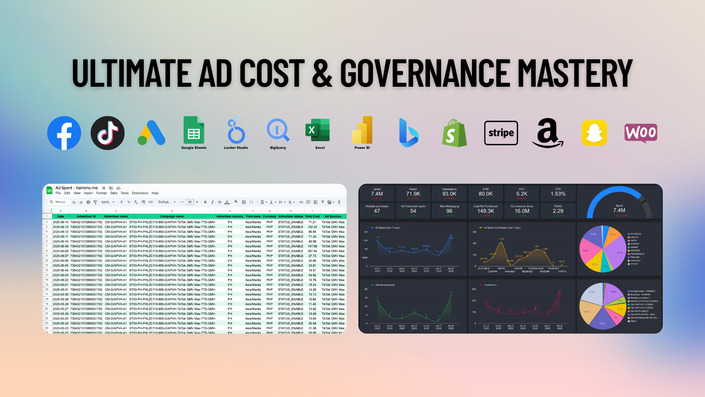
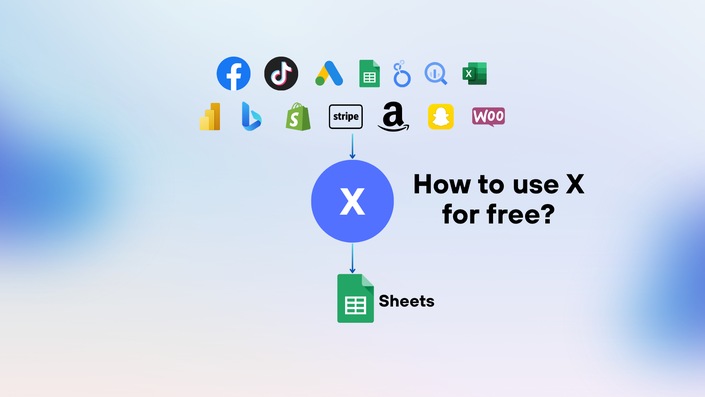
- Connect data from Google Sheets, Excel, BigQuery, and other popular sources
- Create and customize visualizations like Time Series, Bar Chart, Pie Chart, Scorecard, etc.
- Build dashboards with a clear structure for internal use or client reporting
- Use advanced features like Blend Data, CASE WHEN, Regex, Parameters, and more
- Apply Conditional Formatting, Filter Controls, Date Range Selectors, Navigation, etc.
- Set up sharing, permission control, website embedding, and exporting options
Why Use Looker Studio?
- 100% free from Google, with no time limits
- Intuitive drag-and-drop interface, accessible to anyone
- Clear and effective dashboards that convey insights instantly
- Connect once — Looker Studio updates data in real time
- Suitable for various use cases: finance, marketing, operations, KPIs, and more
Course Includes
- Short, clear video tutorials that are easy to follow
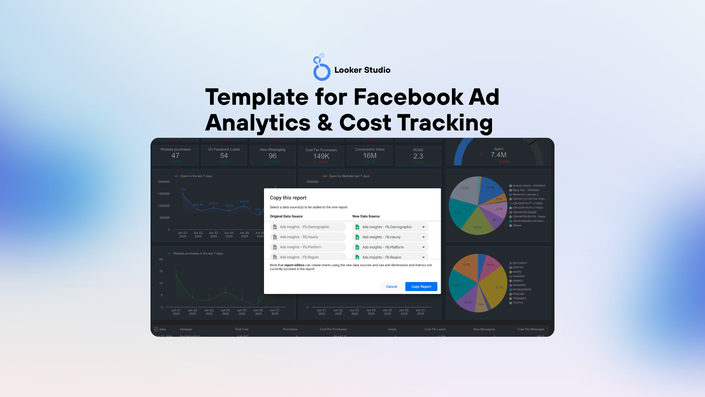
- Ready-to-use Looker Studio templates you can copy instantly
- Real-world exercises and checklists to solidify your skills
- Guidance on error handling, working with complex data, and dashboard performance optimization
- 1-on-1 support for troubleshooting during learning and practice
You will build an ad cost management dashboard using free tools.


Course Content Includes
Welcome & Course Introduction
Available in
days
days
after you enroll
MODULE 1: The Importance of Data Analytics for Marketers & Business Owners
Available in
days
days
after you enroll
MODULE 2: Using Looker Studio for Ad Data Visualization
Available in
days
days
after you enroll
- 1. Why Use Looker Studio for Ad Analysis? (5:50)
- 2. Connecting Google Sheets to Looker Studio (4:42)
- 3. Navigating the Looker Studio Interface (7:27)
- 4. Creating Dimensions and Metrics in Looker Studio (4:24)
- 5. Setting Up Theme & Layout (10:26)
- 6. Customize Chart Style (9:29)
- 7. How to Add and Configure: Table, Scorecard, Time Series, Bar (13:26)
- 8. How to Add and Configure: Pie, Geo Chart, Line, Area (7:02)
- 9. How to Add and Configure: Scatter, Pivot Table, Bullet, Treemap, Sankey (7:40)
- 10. How to Add and Configure: Gauge, Waterfall, Timeline, Funnel (5:15)
- 11. Adding Interactive Controls: Date Range & Filters (19:22)
- 12. Creating Basic Metrics & Custom Calculations (6:20)
- 13. Filter in chart (3:49)
- 14. Page Management & Responsive Design Tips (4:39)
- 15. Sharing & Publishing Your Report (5:15)
- Quiz
MODULE 3: Advanced Techniques in Looker Studio
Available in
days
days
after you enroll
- 1. Advanced Calculations: GROUP, BIN (10:41)
- 2. Advanced Calculations: CASE WHEN, REGEXP,... (16:16)
- 3. Conditional Formatting (4:51)
- 4. Add a Field & Create Parameters for Dynamic Input (9:23)
- 5. Blend Data from Multiple Sources (14:18)
- 6. Automating Refresh Data in Looker Studio (2:02)
- 7. Common Issues & How to Troubleshoot Them (9:28)
- Quiz
MODULE 4: Practice – Building an Ad Spend Management Dashboard
Available in
days
days
after you enroll
- 1. Objective of This Practice (2:03)
- 2. Visualizing Ad Spend with Time Series, Bar Chart, and Line Chart (8:46)
- 3. Ad Spend Scorecard by Platform: Facebook, Google, TikTok (6:14)
- 4. Advertising Budget Insights by Country, Objective, and Account Status (7:32)
- 5. Ad Spend Details by Marketer, Product, and Platform (12:32)
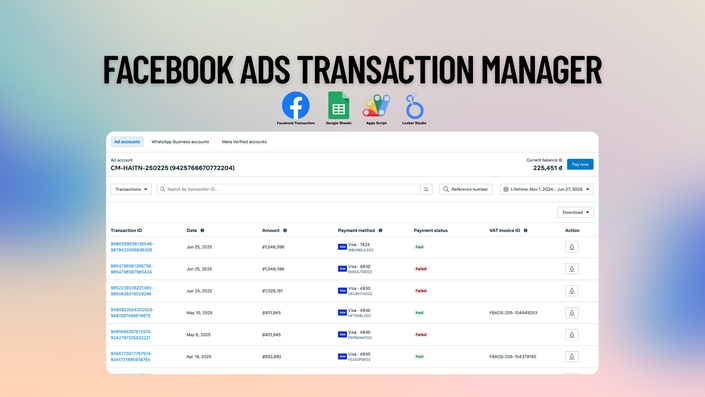
MODULE 5: Practice – Facebook Ads Analytics
Available in
days
days
after you enroll
- 1. Objective of This Practice (3:44)
- 2. Prepare Your Facebook Ads Data (5:27)
- 3. Ad Performance Scorecard Overview (9:13)
- 4. Cost, Conversion, and ROAS Scorecard Overview (5:43)
- 5. Ad Spend Trends and Distribution: Line Charts & Pie Charts (5:26)
- 6. Ad Performance Metrics Table (5:42)
- 7. Ad Performance Breakdown by Gender and Age: Table & Pie Charts (2:26)
- 8. Ad Spend Analysis by Hour and Placement (4:44)
- 9. Ad Performance by Region: Table & Heatmap Visualization (5:59)
Referral Program – Earn by Sharing the Course
Available in
days
days
after you enroll
Final Words – Thank You & What’s Next
Available in
days
days
after you enroll
Professional Learning Interface

Learn Conveniently with the Teachable App


![[EN] Trần Nhật Hải](https://static-media.hotmart.com/p1gtp39KAc-RITPiaF7SBq57fsk=/30x30/https://uploads.teachablecdn.com/attachments/caf0d45e8caa44cea6501e8039d24599.png)